How to load test a website
A step-by-step guide with a real experiment: where a server stops scaling and why it doesn't show up as an error
Introduction: a fast page is not a fast website
Open your website, and it loads in a blink. But that is one visitor on an empty server. The real question is what happens when a newsletter goes out, a post goes viral or a sale starts - and hundreds of people open the same pages at the same moment.
A load test answers exactly that: it sends many requests at once and shows how the server copes. In this guide we explain the few numbers that matter, run a real experiment and walk through the steps to test your own website.
Four numbers: what a load test measures
- Concurrency - how many requests are in flight at the same time. This is the load you set: 10 concurrent requests is roughly 10 visitors clicking at the same second.
- Throughput (requests per second) - how many requests the server completes per second. This is the capacity you measure.
- Response time percentiles - p50 is the typical visitor, p95 is the slowest one in twenty. The average hides the slow requests, the percentiles don't.
- Errors - failed connections and non-2xx responses (500, 502, 503, 504). The point where they appear is the hard limit of the website.
The experiment: a dynamic page vs. a static file
We took a small test stack: nginx in front of a PHP application (Laravel) with PHP-FPM limited to 5 workers - a common setting on small servers and the default of many Docker images. On it we tested two URLs:
- A dynamic page - rendered by PHP on every request, about 18 ms for a single request.
- A static file - served by nginx directly, PHP is not involved at all.
Each run sent 1,000 requests with ApacheBench (the same engine Siteload uses), and we raised the concurrency step by step: 1, 2, 5, 10, 25, 50 and 100.
A fair note: the load generator ran on the same machine as the server, so the absolute numbers are lower than on a dedicated server. The shape of the curves is what matters - and you will see the same shape on any server.
The results: the ceiling is the number of workers
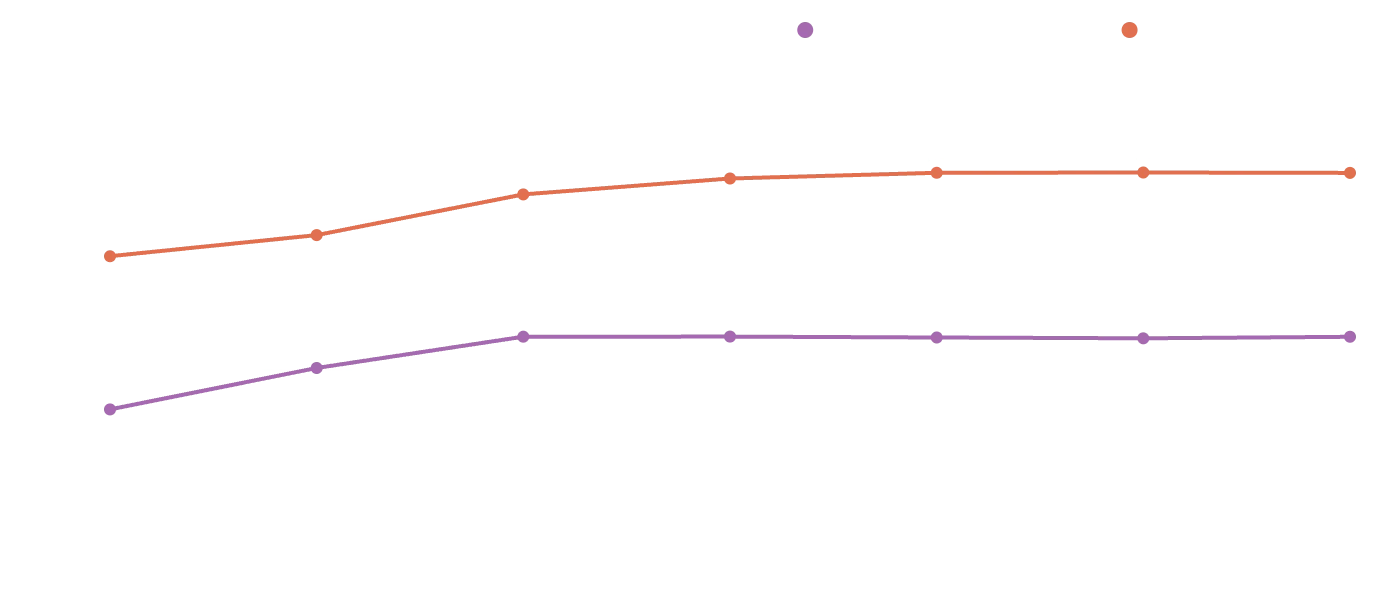
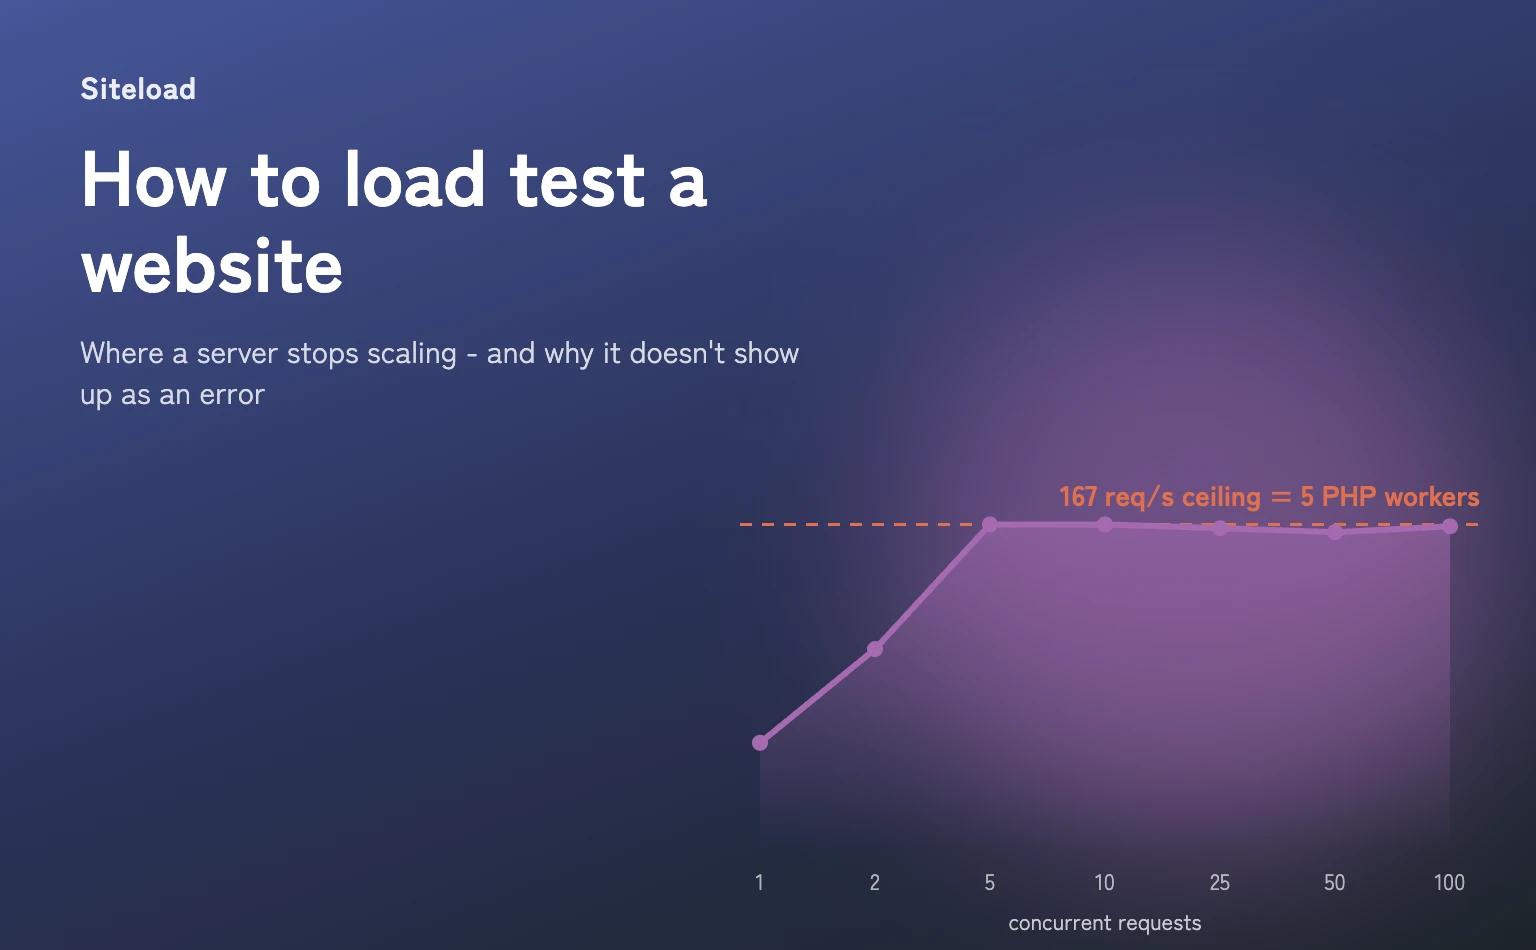
The dynamic page grows from 55 to 167 requests per second - and stops exactly at 5 concurrent requests. 5 is the number of PHP workers. From that point on, adding visitors doesn't add throughput: every worker is busy, and new requests wait in a queue.
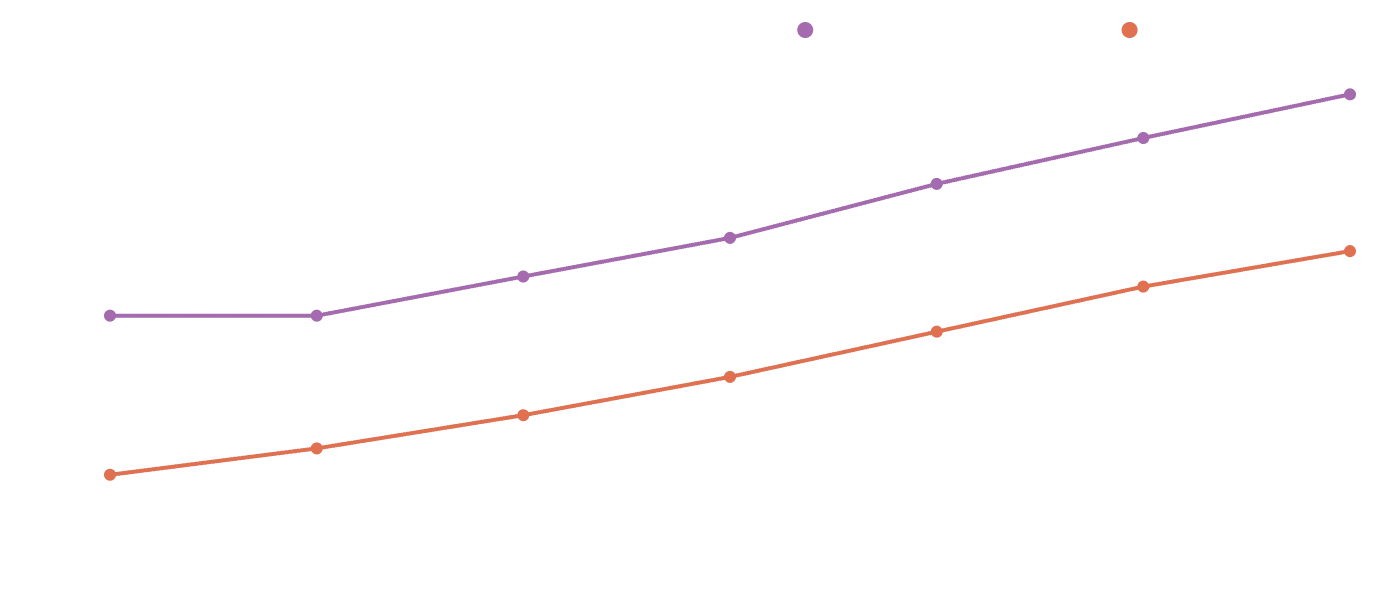
And the queue is visible in the response time. At 100 concurrent requests the slowest 5% of visitors waited 689 ms instead of 23 ms - 30 times longer, although the server did exactly the same work per request. The math is simple: 100 requests in the queue divided by 166 requests per second is 0.6 seconds of waiting, which is what we measured.
| Concurrent requests | Dynamic, req/s | Dynamic, p95 | Static, req/s | Static, p95 |
|---|---|---|---|---|
| 1 | 55 | 23 ms | 574 | 2 ms |
| 2 | 103 | 23 ms | 793 | 3 ms |
| 5 | 167 | 42 ms | 1,482 | 5 ms |
| 10 | 167 | 76 ms | 1,892 | 9 ms |
| 25 | 165 | 174 ms | 2,063 | 18 ms |
| 50 | 163 | 352 ms | 2,073 | 36 ms |
| 100 | 166 | 689 ms | 2,061 | 62 ms |
1,000 requests per run, no failed requests and no non-2xx responses in any run.
The static file reached about 2,000 requests per second - 12 times more - because nginx serves it without waiting for PHP.
The catch: slow is not an error
Look at the table again: zero errors in every run. Every request got a 200 response. A monitor that only checks if the website is up would report that everything is fine - while every visitor waits several times longer than usual.
That is why the response time percentiles are the main result of a load test, not the error count. Errors come much later: when the queue grows longer than the web server is ready to wait (a 502 or 504 from nginx), or when the timeouts of the visitors' browsers run out.
A side effect: 7,000 requests, 7,003 new database rows
After the test we found something we didn't measure: the sessions table had 7,003 new rows. The application stores sessions in the database, and every anonymous request - every visitor without a cookie - started a new session and wrote it to the database.
Bots and crawlers don't keep cookies either, so they do exactly the same on a live website. Such side effects (sessions, logs, cache entries, analytics events) are invisible on one request and become a problem under load. After a load test, check what grew in your database and on disk.
Step by step: how to load test your website
- Pick the pages. The home page is usually cached and fast. Test the pages that run code on every request too: search, product filters, cart, an API endpoint - and the 404 page.
- Measure one request first. If a single request already takes a second, a load test will only confirm it. Check the time to first byte with our free response time checker.
- Increase the concurrency step by step. Start with 1-2 concurrent requests for a baseline, then 5, 10, 25, 50. Stop when errors appear or p95 grows beyond what you accept (for example 1 second).
- Find the knee. The concurrency where requests per second stop growing is the capacity of the website. Beyond it, more visitors only means longer waiting.
- Compare it with your peak traffic. Take the busiest minute from your analytics, not the daily average. If the peak is close to the knee, it is time to add workers, cache more pages or upgrade the server.
- Fix, re-run and compare. Run the same test after every change and put the results on one chart. Otherwise you never know if the change helped.
- Be careful with production. A load test uses the same server as your visitors. Run big tests at a quiet time or on a staging copy - and only on websites you own.
Conclusion: know your ceiling before your visitors find it
Every dynamic website has a ceiling, and on a typical PHP server it is set by the number of workers. Below it, the website is fast. Above it, nothing breaks - the website just gets slower with every new visitor, and no error tells you about it.
A load test finds that ceiling in a few minutes. Then the fix is usually simple: cache the pages that don't change, serve them without PHP, or give the server more workers if it has the memory and CPU for them.
Run a free load test with up to 1,000 concurrent connections, see the response time of every request and compare the results after each change.
Learn about load testingAnd to know when the website stops responding at all, set up uptime monitoring - it emails you when it goes down and when it is back online.